Vercel Sandbox now supports memory observability
Vercel Sandbox observability now tracks memory usage through the dashboard and CLI metrics. Developers can inspect average, P75, and P95 memory metrics alongside CPU and data transfer data. Charts feature automatic scaling against memory limits and reference lines to monitor usage against configured thresholds.
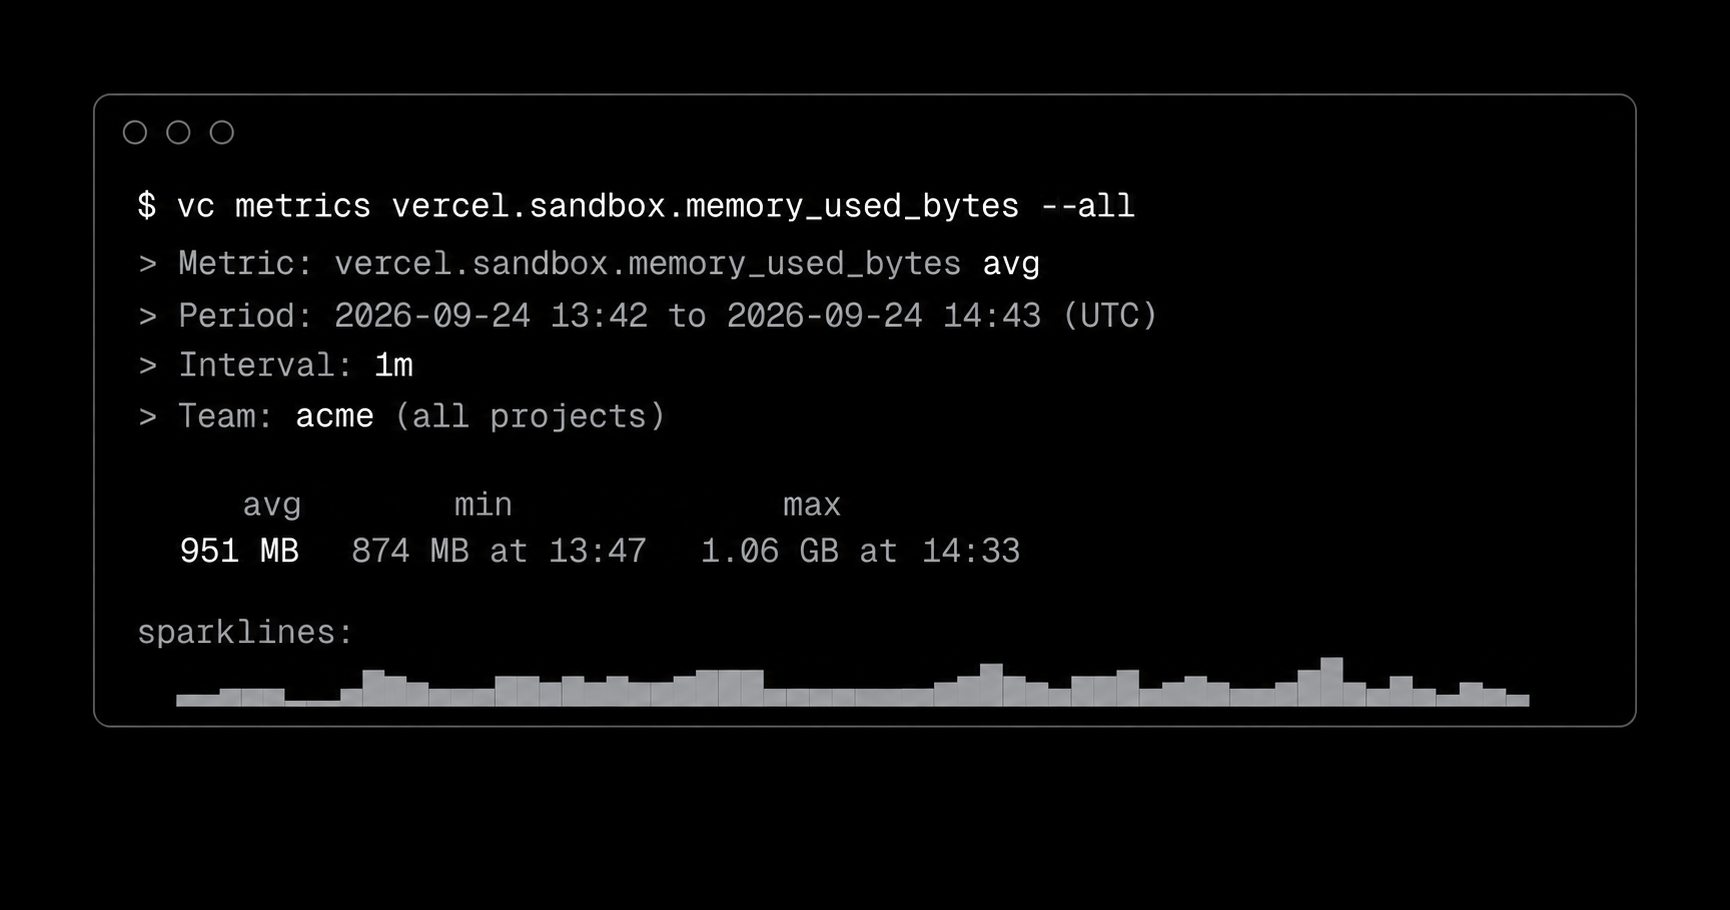
Vercel has added memory usage tracking to its Sandbox observability feature. The dashboard now displays average, P75 and P95 memory metrics together with existing CPU and data‑transfer figures. The CLI also reports memory via the vercel metrics command, exposing the vercel.sandbox.memory_used_bytes measure. Charts automatically scale the vertical axis to each sandbox’s memory limit and draw a reference line at 85 % of that limit. Seeing memory consumption alongside CPU and traffic helps developers identify bottlenecks before a sandbox hits its ceiling. The ability to query memoryUsedBytes and set alerts gives teams finer control over resource planning. Automatic scaling of chart axes and the 85 % reference line make it easier to spot when a sandbox is approaching its configured threshold. It remains unclear how the new memory data will impact pricing or quota calculations, as Vercel has not disclosed any related changes. The long‑term reliability of the memory metrics across all project sizes is also uncertain, pending further performance validation from Vercel.